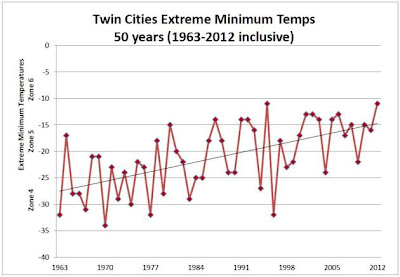
The chart comes from Paul Douglas' superb "On Weather" blog, explained as follows:
Jack Falker from Edina sent me a PDF of a study he conducted on the new USDA Plant Hardiness Zones, showing a national warming trend in recent decades. "EMT" is extreme minimum temperature. Quite simply Jack plotted the coldest nighttime low observed in the Twin Cities for every winter since 1963. Is this all urban heat island, since the metro has grown in the last 50 years? Falker checked with the Landscape Arboretum in Chanhassen, well away from the core of the metro, which experienced a similar warming trend. He writes: "To see just how much things have changed in the last ten years, it is very interesting to look at the 50 year period 1963 to 2012 (inclusive), when the average annual EMT was -21.1, ( Zone 4b). But again, the last ten years pull the average, so if you look at the 30 year period 1963 to 1992, you get a better historical picture, with an average annual EMT of -23.4 degrees. What jumps out at you, as you look back at the 1960s and 1970s, is just how much colder it was back then. For example, there was a period in 1970, between January 17th and January 21st when it didn’t go above zero for 4 ½ days, with a low temperature of -34 and a high of -3. Now that was a zone 4 winter! Another thing that jumps out at you is how many -20 degree days occurred in December and February, during those decades. This is something we haven’t seen in several years. Here is a graph of that 50 year period. Notice the upward slope of the graph, right out of Zone 4 into Zone 5."When I was a kid,
Related: The new USDA plant hardiness zones.

ليست هناك تعليقات:
إرسال تعليق